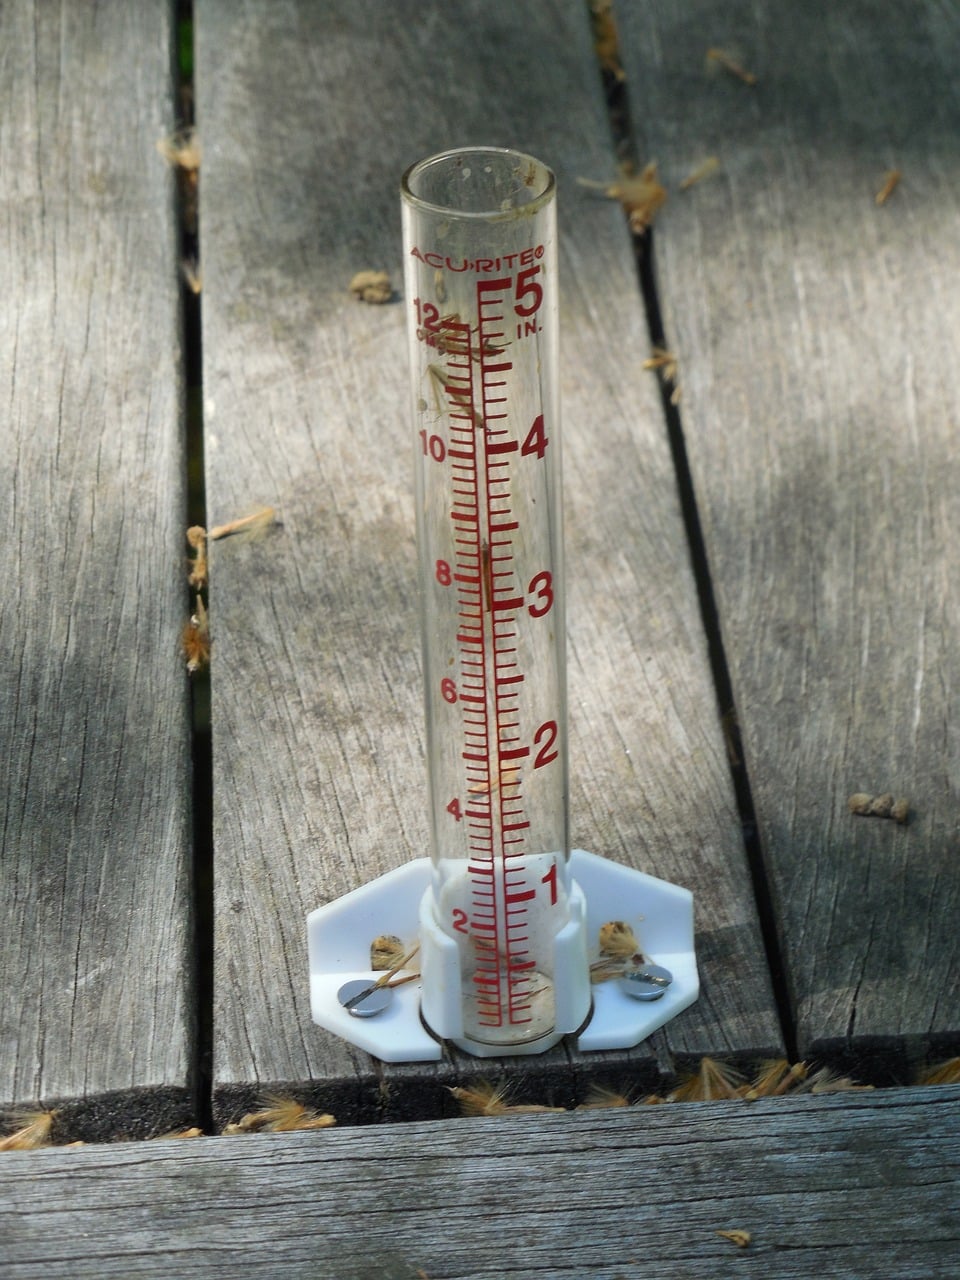
 Rain insurance is purchased to help protect the insured against rainfall at their event. The expectation is that the policy will pay out a claim when the rain threshold is met (e.g. 0.5″ of rain is recorded at the event.) To measure rainfall, most insurance providers allow the policyholder to choose between an on-site observer, data from the nearest National Weather Service location (typically an airport), or third-party data such as doppler radar data. However, one option on the market offered by some providers uses a much less accurate method of measurement. Gridded rainfall data uses the average rainfall across a 4,000-acre grid to determine if a claim is to be paid. If it’s less accurate, why would anyone choose such an option?
The rain insurance carrier offering the grid solution prefers that insureds use that option for several reasons. It is readily available, if you have the proper software to download and decode the data, which the insured typically does not have. This makes it virtually impossible for a buyer to obtain the data themselves. It’s also easy for the insurer to fully automate the process of underwriting and reviewing quotes and consulting with the insureds.
However, the primary, and perhaps most concerning, reason is that using gridded rainfall data may typically result in far less claims. One common issue associated with gridded precipitation products, is their tendency to underestimate rainfall when compared to point measurements. This discrepancy can be attributed to several factors:
Spatial Variability: Gridded precipitation datasets represent average values over a specific spatial grid, covering an area of approximately 4,000 acres. However, individual rainfall events can exhibit significant spatial variability, meaning that precipitation amounts at specific locations, such as a festival location, fairgrounds, or golf course, can vary immensely within a grid. If the chosen point for measurement experiences higher precipitation, the gridded dataset precipitation value may greatly underestimate rainfall at that specific location.
Gauge Network Density: The Stage IV QPE product relies on a network of rain gauges to estimate precipitation across the grid. If the density of rain gauges is low in a particular region or if there are gaps in the coverage, the gridded product may not represent the true variability of precipitation in that area. This can also lead to large underestimations when compared to point measurements.
Orographic Effects: Gridded precipitation products may struggle to accurately represent orographic effects, which involve the impact of terrain on precipitation patterns. If the point of comparison is in an area with complex terrain, such as hills or valleys, the gridded dataset may not fully capture the localized enhancement of rainfall due to terrain features.
Temporal Resolution: Gridded precipitation products typically provide data at regular time intervals (e.g., hourly or daily). If the rainfall event is short-lived or characterized by intense, localized convective storms, the gridded dataset may miss the peak rainfall intensity at the specific point, leading to significant underestimation.
Algorithm Limitations: The algorithms used to interpolate and estimate precipitation in gridded datasets have inherent limitations. These algorithms may not capture certain meteorological processes accurately, particularly in extreme or complex weather conditions.
It’s crucial to approach comparisons between gridded datasets and point measurements with an understanding of these factors. Users should be aware of the limitations of gridded precipitation products and consider the specific characteristics of the region and event under investigation. They must also understand, and accept, that a rain insurance claim will be based not on the rainfall that occurs at their event, but rather on the grid-average value, which may be far less.

